.png)

Last week, our offices had Anne-Marie, Chief Economist at the Calgary Real Estate Board give her updated views since their latest forecast in the Spring, how things have evolved over the summer and what's potentially in store for the rest of the year. Some interesting takeaways I wanted to share.
What Has Happened this Year?
Sales Down (Remains Above LT Trends)
We've seen sales slow down, this year in comparison to the previous years with record high activity, across all segments of the housing market.
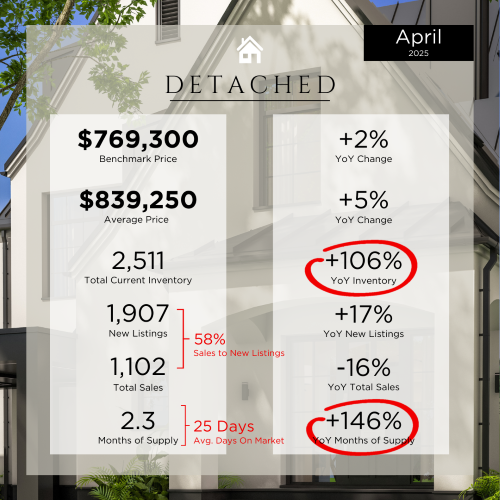
Detached Homes: -17% drop in sales activity
Semi-Detached: -16% drop in sales activity
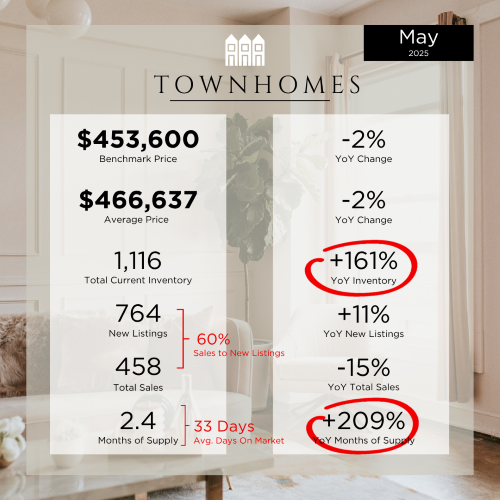
Row Homes: -22% drop in sales activity
Apartments: -34% drop in sales activity
In basic form, a drop in sales is due to a reduction in buyer and sellers meeting to achieve a sale. Slower demand (which we will discuss further below) and an increase in supply (higher supply) has widened this gap, relative to prior years. The silver-lining here is that, despite the slowdown, trends still remains above long-term trends for Calgary. I would see this as a slight market pullback from furious activity in prior years, which is healthy for an evolving market.
One of the largest drivers of a drop in demand has been the ease in population growth.
International Immigration: 50% decline in 2025 compared to 2024
Interprovincial Immigration: 28% decline in 2025 compared to 2024
In Calgary, we're expecting a +3.1% population growth rate (compared to a +6% growth in 2024). Calgary still continues to attract families and individuals, which is why we're still seeing a positive growth rate, albeit, a bit slower.

Rental Market Shift
As a result of the slower migration, we've seen a material shift in the rental market, further complicated by purpose-built rentals.
Currently in Calgary, we've seen an enormous mountain of rental inventory come online over the last few quarters, ultimately impacting the net rental prices achieved (estimated vacancy rate is about ~9%). These figures also don't capture the 'shadow market' which are privately owned and operated landlord operations, only the big institutional figures that are publicly available dataset.

New Home Supply Continues to Grow
Resale market continues to compete with a the growing new home inventory. A lot of the new supply has been in the apartment sector, and most of which also represent purpose-built rental units.


Sales to New Listing Ratio (Resale Market)
We've seen a bloating of resale inventories over the last few months as I'm sure everyone has noticed, a lot more selection for buyers these days.
In July, we've seen a 48% increase in inventories (YoY), reaching now above the 10-year average inventory figure of 5,866.
In August, we've seen ~57% sales to new-listings, which means for every 1 sale, there are about 2 new listings that come up. Our 10-year average rate has been ~64% absorption. While this is down from the 62% seen last August, we're still above 50% which remains healthy. Area of concern is when we start seeing sub-50% ratios.

Calgary Remains TOP for Affordability
Compared to the national housing averages and in context with median household income of key metropolitan areas, Calgary remains the top destination for affordability (leading to continuing population growth). Sure our sales rate has slowed, but our population rate continues to grow and is backed by a strong Alberta economy (more below).

Alberta LEADS National GDP
It's no question - the Canadian economy is cooked. Regulation, tax systems, foreign investment appetite and growing public sector have all been detrimental to the growth and attractiveness of our economy, unfortunately. Coupled with lower immigration overall, and uncertainty of tariff impact on steel, aluminium, and auto - this is not good for Canadians. Despite this, the Alberta economy is slated to ring in the strongest growth amongst all provinces, signalling this is where people want to be for employment / investment opportunities.
Changes in interest rates will be what the market will be keeping an eye on for future financial incentive of cheaper debt. With key inflation figures well within range for the BoC, we could see fewer rate cuts, and this time largely driven to incentivize growth.
Calgary's employment figures have also been strong, albeit slower than previous years. Important to note here the mix of job-types - with professional, scientific and technical jobs leading to the top gains. This, hopefully underscores the quality of demographics our city setting us up for strong durable growth in the future.


I know, it's a lot to distill - but in summary: we've seen a pullback in demand and material supply increases, following HUGE advances in sales and price growth. These levels are not of concern. The Alberta economy is primed to lead the country in growth, with Calgary's job market leading quality advances. Fundamentally remains a healthy market (while the rest of the country is seeing detrimental activity in real estate).
For my buyer clients: this slowdown in activity has been long-awaited. There's no saying when the window of opportunity and vast selection of properties will close; most importantly, making a move could set you up for a lifestyle, financing terms, and home selection we've been waiting for - act, prepare now.
For my seller clients: it may be discouraging seeing some of these figures, but that means you need a strong team at your back. Price strategy is KEY. Marketing is more important than ever, and professional advice is imperative. Get ahead of the market to achieve your goals, and we are here to help.